Over the past decade, the entire IT industry has been pushing toward cloud computing. A recent article by Gartner argues the IT industry will be entering a second wave of cloud computing growth fueled by enterprise adoption. At Blue Yonder, we use the public cloud to offer our services with greater flexibility and on a global scale. The nature of your expenses changes quite radically during the shift from an on-premise model to the cloud. In on-premise, your costs are largely capital expenditures. You pay for hardware and how you use it determines how well that money was spent. However, you cannot undo that initial payment. In the cloud, it is all operational expenses. If you do not use resources you can and should turn them off. This introduces additional complexity on the operating model of your services, but is also a great opportunity to constantly improve your operational margin.
Concept
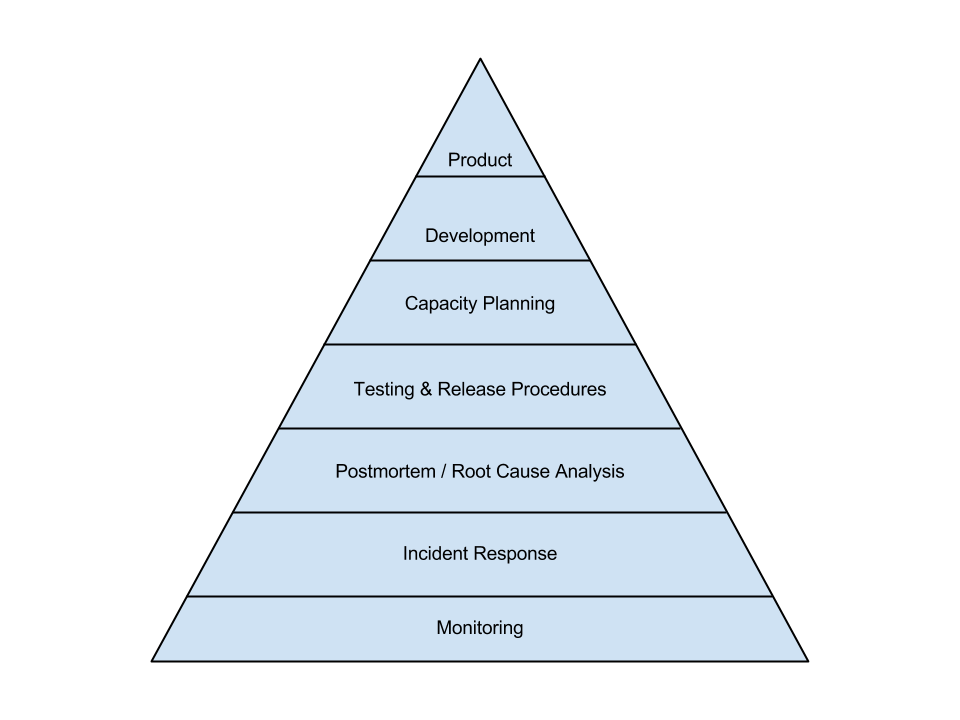
The basic idea advocated in this blog post is to enable this cost control and optimization via the internal monitoring system in use. According to the book Site Reliability Engineering published by Google in 2016, monitoring is the most basic and essential element in making a service reliable. This is nicely illustrated by the service reliability hierarchy, following the scheme of Maslow’s hierarchy of needs:
Your operational margins are influenced by your product offering and how you run production systems. It is thus quite natural to provide visibility into cloud costs in the same way you provide visibility into your system behaviour. Once the monitoring has access to the cloud usage details, you gain the following benefits:
- Alerting can be done directly on your expenses with the tools that you use for regular alerting. That way, you can prevent unhealthy cost spikes going unnoticed. Essentially, excess usage above a certain threshold should be treated as an incident with all the processes included, like post mortem and root cause analysis.
- Correlation of infrastructure costs with other metrics about your systems like utilization or spikes in workload. This is necessary in particular for resources that are billed by usage (network traffic, storage operations, storage capacity, or function invocations). In case of a more static usage, it is also useful to measure usage of resources. Very often, resource consumption has no one-to-one relation to the end-user. This connection needs to be established afterwards, especially in multi-tenant environments.
- Accessibility for developers and operators alike. By using the same tools they use in their everyday work, it becomes very easy to expose developers to these numbers. This increases awareness and encourages everyone to think and optimize for costs.
Technical Solution
We utilize Microsoft Azure for our cloud deployments as well as Prometheus for the monitoring of our systems. Consequently, to implement the concept above, we need to inject usage information from Azure into our Prometheus instances. Prometheus has a pull architecture – you define targets that are scraped for the latest metrics. A common scheme is to use a so-called exporter that returns the metrics of interest for a given system if that does not support Prometheus natively. We have done exactly that with our open source project azure-costs-exporter. It is a simple web application written in Python that queries usage data from the Enterprise Agreement (EA) billing API. After the simple installation, providing just a little configuration is sufficient to get a working export from your specific Azure EA enrollment:
ENROLLMENT_NUMBER="123456"
BILLING_API_ACCESS_KEY="XXX"
PROMETHEUS_METRIC_NAME="azure_costs_eur"
More details of deployment and installation can be taken from the project documentation.
Inner Workings
The usage data is provided by the Azure API as a JSON document:
[
   {
    "Date": "05/01/2017",
    "DepartmentName": "dept1",
    "AccountName": "account1",
    "MeterCategory": "Virtual Machines",
    "MeterSubCategory": "Standard_D1_v2 VM (Non-Windows)",
    "ExtendedCost": 0.002322875509546761,
    "ResourceGroup": "your_resource_group",
    "Tags": "tag1",
    ...
   },
   {
    ...
   }
]
The exporter aggregates several records (by summing the ExtendedCost field) so that only a few fields remain that we have defined as significant for further analysis. These fields are then transformed into labels within Prometheus. This results in a single metric with multiple labels for all usage and cost information. The following exemplary output might be given by the azure-costs-exporter:
azure_costs_eur{DepartmentName="dept1",MeterSubCategory="standard_d15_v2 vm",ResourceGroup="group1",MeterCategory="virtual machines",SubscriptionName="dev",MeterName="compute hours",AccountName="account1"} 31.43
azure_costs_eur{DepartmentName="dept1",MeterSubCategory="standard_d1_v2 vm (non-windows)",ResourceGroup="group2",MeterCategory="virtual machines",SubscriptionName="dev",MeterName="compute hours",AccountName="account1"} 34.49
azure_costs_eur{DepartmentName="dept2",MeterSubCategory="standard_d1_v2 vm (non-windows)",ResourceGroup="group1",MeterCategory="virtual machines",SubscriptionName="dev",MeterName="compute hours",AccountName="account1"} 45.84
Analysis with Prometheus
Using labels has the advantage that aggregations on the label level are easy and directly supported by Prometheus. The following query for example will give you a breakdown of your entire expenses in the current month by MeterCategory:
sum(azure_costs_eur) by (MeterCategory)
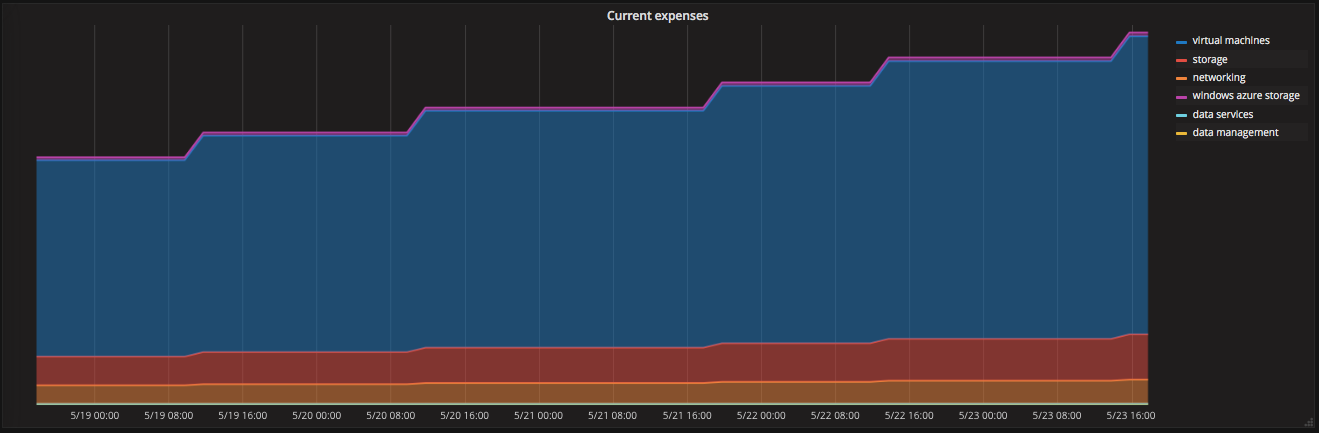
The steps in the graph correspond to the update cycle of the billing API.
Advanced Usage
A property of the Azure billing API is that its values are reset at the beginning of a new month. This can be seen in the following graph:
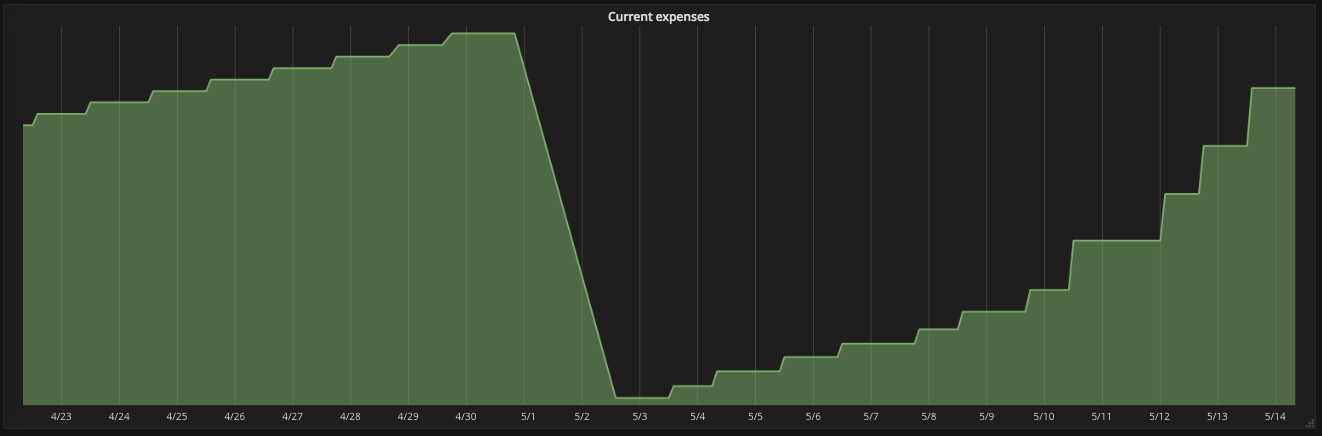
Luckily, Prometheus can deal with such resets. Several query functions allow to compensate for breaks in monotonicity. The increase query function for example calculates the increase in the time series in a given time interval. The following query illustrates that:
sum(increase(azure_costs_eur[10d]))
It returns the costs of the last 10 days, even if a reset happened in that period. The rate query function calculates the average per second rate of that increase. Using this function, we can define a query that extrapolates costs.
This query:
sum(rate(azure_costs_eur[3d])) * 3600 * 24 * 30
takes the average increase per second in costs from the last three days and scales that to 30 days. This way, the result corresponds to the monthly costs as long as the footprint of the last three days remains constant. The following graph shows such a query broken down by subscription:
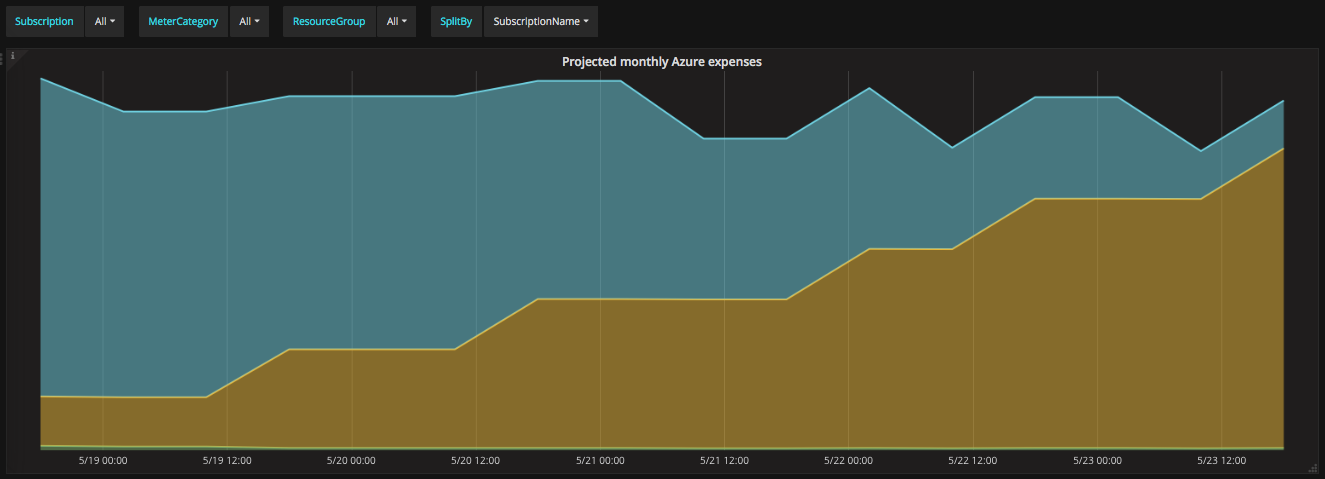
We can use this query to define an alert in Prometheus. In another case, a business does not expect the monthly costs to reach €1 million for the foreseeable future. If the business can see that they would be on track to reach that burn rate, it would be considered an incident and warrant immediate reaction!
The following alert definition allows us to do that and thus limit the potential financial damage to a fraction of the monthly limit:
ALERT AzureCostExplosion
    IF sum(rate(azure_costs_eur[3d])) * 3600 * 24 * 30 > 1000000
    FOR 15m
    LABELS {severity="page"}
    ANNOTATIONS {description="This is an unexpected high cost spike that requires immediate investigation.",
    summary="At the current burn rate, we will spend {{ $value | humanize }} EUR per month."}
Conclusion
We would be very interested to hear about your experiences with cost control and optimization in the public cloud. If your tech stack is similar to ours, check out our open source project. We are eager to hear your feedback and incorporate improvements!